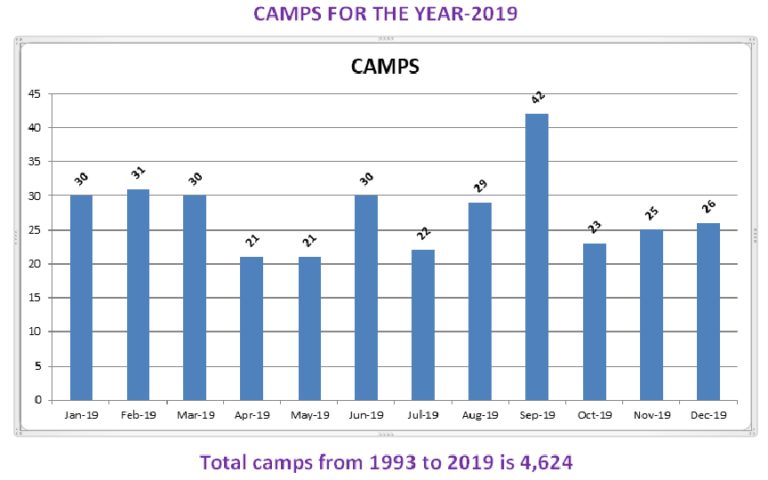
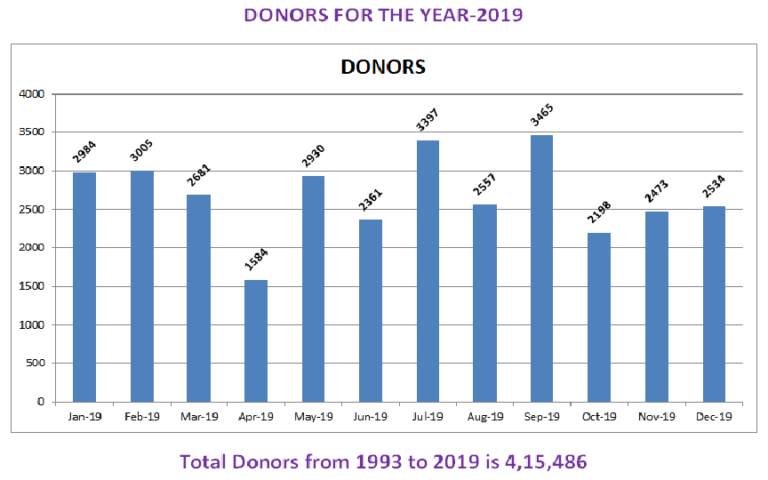
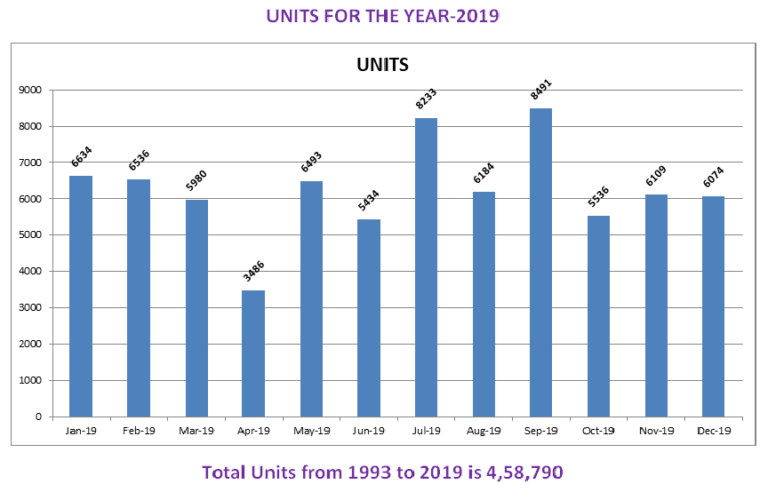
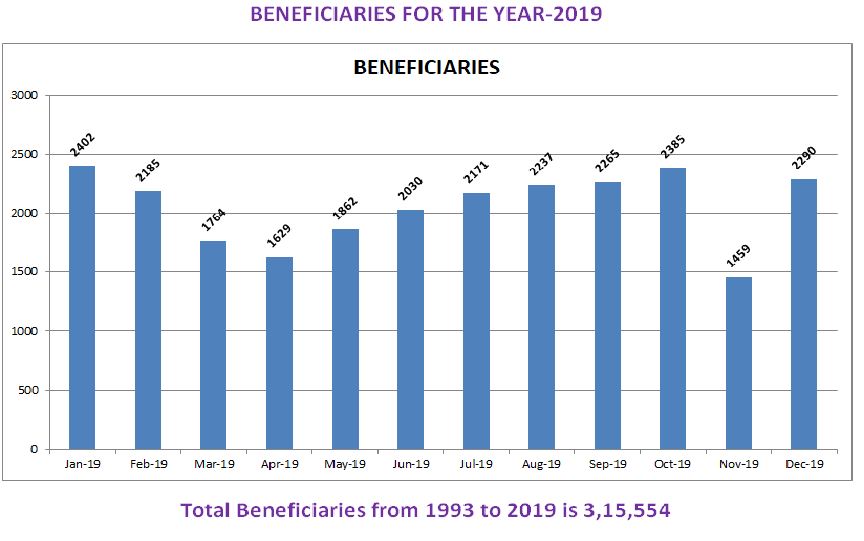
Overall Statistics Statistics of the year 2019 Total Camps for the year 2019 = 330 Total Donors for the year 2019 = 32,169 Total Units for the year 2019 = 75,190 Total Beneficiaries for the year 2019 = 24,679 Total Recipient for the year 2019 = 73,143 Get Involved Lets Change the World, Join Us Now! Contact Us
")